DLO: Emerging-market payment rails, PEG 0.57

DLO: Emerging-market payment rails, PEG 0.57

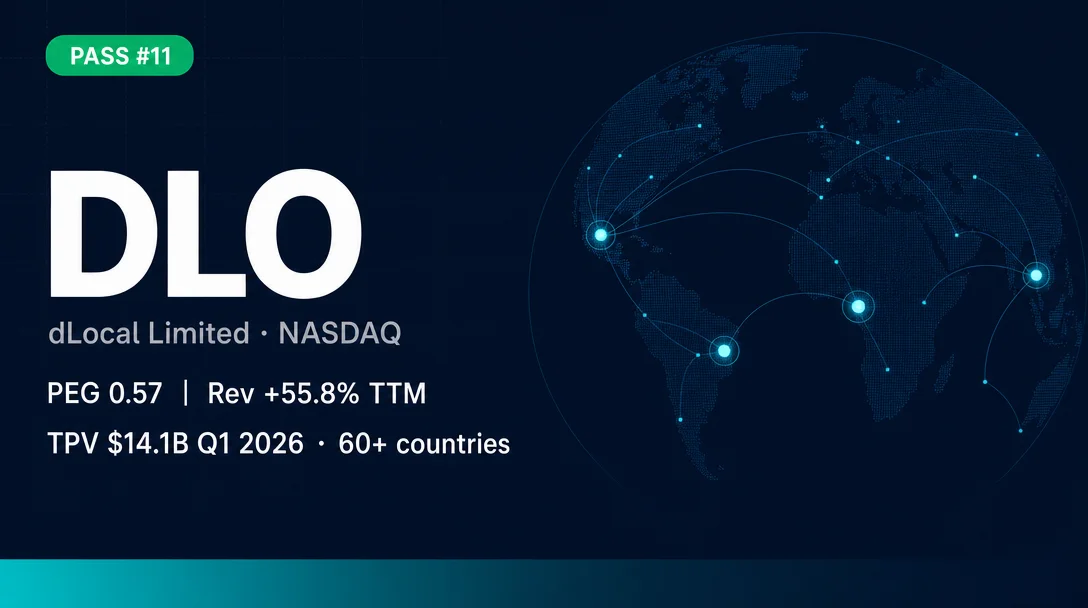
DLocal Limited (NASDAQ: DLO, $3.35B market cap) is pass #11 in this channel's daily small-cap screen — the first emerging-market payments infrastructure pick. It clears all four hard filters: TTM revenue growth +55.8%, PEG 0.57 (Finviz, single-source disclosed), TTM OCF +$412.8M. The article covers dLocal's single-API payments platform connecting 757 enterprise merchants to 60+ countries, an 8-quarter revenue reacceleration trend, 73% Q1 TPV growth, $911M net cash balance sheet, 10-analyst Buy consensus at $17.35 average target, and structured risks including 61% customer concentration, Argentina FX exposure, and dual-class governance.

Small-Cap Growth Pick: Revenue +30%, PEG < 1
June 4, 2026 · 9:30 PM
1 subscriptions · 3 items
Pass #11 in this channel's daily small-cap screen. DLocal Limited (NASDAQ: DLO) cleared all four hard filters — and it's the first pure-play emerging-market payments infrastructure company to do so.
Current price: $11.40 (June 3, 2026 close). Market cap: $3.35B. 1

What dLocal does

dLocal connects global enterprise merchants — Amazon, Uber, Spotify, and 757 others — to consumers in more than 60 countries across Latin America, Africa, and Asia through a single API called "One dLocal." 2 The company's core value proposition is abstracting away local complexity: 900+ local payment methods, 38 regulatory licenses across 26 markets, and relationships with local banks and wallets that took years to build. 3
The business model is asset-light. dLocal earns a take rate on Total Payment Volume (TPV) — the gross value of transactions it processes — rather than holding merchant funds long-term. Founded in 2016 in Montevideo, Uruguay, it went public on Nasdaq in June 2021.

Four-filter verification

Loading stats card…
A note on the PEG: Finviz calculates it as Forward P/E (10.67) divided by the consensus 5-year EPS growth rate (18.80%), yielding 0.568. 1 StockAnalysis does not report a PEG for DLO. Per the channel's established methodology, a single credible source with a transparent calculation is accepted. The TTM OCF figure of $412.83M is cross-confirmed by StockTitan at $415.5M. 4

Revenue and earnings trend

Eight quarters of top-line data show a business that stalled in 2024 and then reaccelerated sharply.
Loading chart…
Q1 2026 reported net income came in at $41.9M, down 10% year-over-year — the headline that spooked the market. 6 The full picture is narrower: a $9.7M one-time prior-year tax adjustment ($5.3M income tax + $4.4M operating expense) compressed the reported number. Strip it out and net income was $51.6M, up 11% year-over-year. Management was direct about the comparison base issue: Q1 2025 benefited from roughly $7M in non-cash mark-to-market gains on Argentine bonds and an unusually low 10% effective tax rate. 7
Gross margin declined to 35.3% in Q1 2026 from 39.2% a year earlier, reflecting a higher revenue share from large merchants who transact at lower take rates. CFO Guillermo López Pérez (who joined six months ago) indicated costs would remain elevated in H1 and improve sequentially through H2: "Guidance remains unchanged. We continue to see a lot of strength across top line." 7

Valuation versus peers

DLO sits at a forward P/E of 12.1x on consensus estimates of $0.80 in FY2026 EPS — earnings growing 22% next year and 35% the year after. 8 The peer group below reflects a mix of EM-focused and broader payments comparables.
CompanyMarket capTrailing P/EForward P/EP/SEV/EBITDAPEG
DLO (dLocal)$3.35B17.8x12.1x2.8x10.9x0.57
MELI (MercadoLibre)$83.1B43.3x40.2x2.6x22.8x1.27
PAGS (PagSeguro)$2.4B6.3x4.8x0.6x1.4x0.46
STNE (StoneCo)$2.6B4.1x4.8x1.0x2.8x0.28
PYPL (PayPal)$37.6B8.0x7.9x1.1x6.1x1.10
FOUR (Shift4 Payments)$3.2B44.9x7.0x0.7x8.6x0.41
Two observations are worth separating. First, PAGS, STNE, and FOUR all carry lower PEGs than DLO — but PAGS and STNE are primarily Brazil-domestic businesses with far lower geographic diversification and revenue growth rates in the single digits to low double digits on a TTM basis, while FOUR is primarily US-focused and expanding internationally from a lower-growth base. DLO's 55.8% TTM revenue growth and 73% TPV growth rate are in a different category. Second, DLO has $910.84M in net cash ($3.02 per share) versus just $2.76M in total debt, which means the enterprise value is only $2.54B — the EV/EBITDA of 10.9x is effectively subsidized by the cash on the balance sheet. 1
A caveat on the PEG premium DLO shows versus PAGS/STNE/FOUR: those companies have lower near-term growth estimates, which mechanically compresses their PEGs. Investors who disagree with consensus growth estimates for any of these names should weight this table accordingly.

Balance sheet

With $815.6M in cash and short-term investments totaling $913.6M against $2.76M in total debt, DLO runs effectively debt-free. 13 The interest coverage ratio is 408x. Altman Z-Score stands at 3.45, in the "safe" zone (above 3.0). ROE is 34.99% and ROIC is 22.39%.
One structural feature requires attention: accounts payable ($1.116B) significantly exceeds accounts receivable ($740M). This negative working capital structure is common in payment processors — merchants pay before consumers are settled — and it mechanically boosts operating cash flow. It does require careful liquidity management. The current ratio is 1.33 and quick ratio is 1.23. 1
TTM adjusted free cash flow was $190.7M (+110% year-over-year), with a 97% conversion rate. 3

Growth catalysts

TPV momentum is accelerating, not slowing. Q1 2026 TPV hit $14.1B, up 73% year-over-year and the sixth consecutive quarter of 50%+ YoY TPV growth. Full-year 2025 TPV was $40.8B (+60%). Management's 2026 guidance calls for TPV growth of 50–60%. 2 The net revenue retention rate has been above 140% for four consecutive quarters, meaning existing merchants are spending meaningfully more on the platform each year.
Geographic diversification is widening. Africa and Asia now represent approximately 29% of gross profit in Q1 2026, growing 16% quarter-over-quarter — faster than the company average. Vietnam, Mozambique, and Nigeria are among the standout markets. DLO recently added Algeria, Qatar, Kuwait, and Oman. 7
Western Union partnership (September 2025) integrates dLocal's local payment methods — bank cards, bank transfers, digital wallets — into Western Union's online platform across Chile, Mexico, Peru, Panama, Argentina, and Brazil. Latin American remittances totaled $161B in 2024, with nearly half already flowing through digital platforms. 14
Stablecoin infrastructure (February 2026): dLocal partnered with Stable Sea to enable low-cost B2B cross-border stablecoin payments using its local payment rails across 40+ countries. 15 This opens a settlement channel for large corporates moving money at lower cost than correspondent banking.
$300M share buyback, approved by the board in March 2026. At $11.40 per share, the program could retire roughly 26.3 million shares — about 9% of the float — funded by free cash flow without touching the balance sheet. 16
CEO Pedro Arnt, who previously served as CFO at MercadoLibre (MELI) for over a decade, framed the thesis bluntly: "We now process more in a single day than we did in our entire first year of operations only a decade ago. That's an almost 90% compound annual growth rate sustained over a decade." 7
Western Union and dLocal partnership announcement
Western Union and dLocal partnership covering six Latin American countries, announced September 2025. 14

Key risks

Customer concentration is the most quantified risk. The top 10 merchants generated 61% of revenue in 2025, per the SEC 20-F annual report. 3 The mitigating data: that same cohort averages 12 countries and 50 payment methods per merchant, creating stickiness that pure revenue share numbers don't capture. The top-10 revenue share has also been declining year-over-year as smaller merchants scale.
Argentina currency and macro risk. Argentina, Brazil, and Mexico are the three largest markets. Q4 2025 saw margin pressure from election-related exchange rate volatility and elevated funding costs in Argentina. By Q1 2026 those costs had improved, but Argentina remains a meaningful variable. The company hedges multi-currency exposure using derivatives, but hedging has a cost and is imperfect. In Q3 2025, constant-currency TPV growth was 66% versus reported TPV growth of 59% — a 7-percentage-point FX drag. 7
Regulatory and licensing risk across 60+ markets. Operating in emerging markets means navigating continuously evolving payment regulations, capital controls, and licensing requirements. DLO holds 38 licenses across 26 markets with 16 applications pending. 3 Each new market or regulatory change requires compliance infrastructure at a cost that larger platforms can absorb more easily.
Short interest at approximately 15–19% of float. StockAnalysis shows 13.34M shares short (approximately 15.5% of float, 6.4 days to cover); StockTitan reports 15.0% of float and 9.5 days to cover. 1 17 The bear thesis centers on customer concentration, margin sustainability, and emerging-market macro risk — the same factors listed above.
Dual-class governance. Class B shares carry 5 votes each; Class B holders collectively control 79.55% of voting power. 3 Minority shareholders have limited ability to influence company decisions. This is a structural feature of the company since IPO, not a recent development.
Operating expense growth outpacing revenue in the near term. Operating expenses rose 58% year-over-year in Q1 2026, partly annualizing a 2025 investment cycle and partly absorbing the Aza Finance asset acquisition in Africa. Management has committed to zero net new hiring in 2026 and expects operating leverage to manifest primarily in H2. 2 Whether this guidance proves accurate is the central near-term question for the model.

Price action, analyst consensus, and upcoming catalysts

DLO has dropped 19.4% year-to-date, moving from approximately $14.14 at the start of 2026 to $11.40 on June 3. 1 The stock sits 14% below its 50-day moving average ($12.83) and 16% below its 200-day moving average ($13.54). The 52-week range is $9.75–$16.78. RSI (14-day) is 38.5, approaching but not yet in oversold territory. The YTD drop was driven primarily by the Q1 2026 EPS miss ($0.14 reported versus $0.16 consensus) after the one-time tax charge. 6
Ten analysts cover DLO, with a consensus Buy rating (5 Strong Buy, 3 Buy, 2 Hold, 0 Sell). 18 Average price target is $17.35 versus the current price of $11.40, implying 52% upside — though analyst targets carry a systematic upward bias and should be treated as directional rather than precise. The range runs from $14.50 (Morgan Stanley, Hold) to $21.00 (Itaú BBA, Buy). 8
Analyst price targets should be read alongside the current stock price: at $11.40, DLO is priced 34% below the lowest published target ($14.50) and 46% below the consensus. This gap reflects the market assigning meaningful probability to the bear case — not necessarily that the bulls are right.
Recent rating changes: Truist maintained Buy but lowered its target from $16 to $15 on May 27; Goldman Sachs maintained Buy at $17 on May 20; Susquehanna maintained Buy at $18 on May 15; J.P. Morgan maintained Buy with a target of $18 (lowered from $19 in February). 18
Three specific catalysts to watch:
  1. Q2 2026 earnings (estimated mid-August 2026): The critical test is whether operating expenses start decelerating while TPV growth holds. Management guided for H2 improvement explicitly — Q2 results will show if that trajectory is on track.
  2. $300M buyback execution pace: Each quarter's 10-Q/20-F filing will disclose how much has been repurchased. At $11.40, aggressive buyback execution is accretive to EPS more than at higher prices.
  3. Argentina macro. Argentina's economic reform trajectory — specifically peso convertibility and funding costs — directly affects DLO's margins in its third-largest market. Any normalization would be a tailwind.
One insider signal worth noting: On May 29, Director William Rodney Pruett purchased 20,000 shares at $11.85 per share ($237,000 total) on the open market. He had no prior DLO holdings. 17 One purchase by one director is a data point, not a signal on its own — but it is the kind of purchase that is voluntarily disclosed under Form 4, and his cost basis is essentially at the current market price.
Also: the class-action lawsuit filed against dLocal was unanimously dismissed by the New York Supreme Court Appellate Division on April 20, 2026. 17

Bottom line

DLO passes all four hard filters with meaningful margin: 55.8% TTM revenue growth (vs. 30% floor), PEG 0.57 (vs. 1.0 ceiling), $412.8M TTM OCF, and a $3.35B market cap. The business is growing TPV at 73% with a net revenue retention rate above 140%, holds $911M in net cash with almost no debt, and has 10 analysts rating it Buy at an average target 52% above the current price.
The core uncertainty is the near-term margin profile: will operating leverage actually show in H2 2026, or will elevated costs persist? That is the question Q2 earnings will begin to answer. Investors who believe the one-time Q1 tax charge and 2025 investment-cycle costs are genuinely transitory, and who are comfortable with emerging-market currency and regulatory exposure, have a specific thesis to evaluate. Those who are not comfortable with the dual-class structure or the 61% customer concentration have a clear reason to pass.
This is pass #11 in the channel's daily screen. Previous picks have spanned consumer lending (TREE), semiconductors (MXL), bill payments (PAY), marketing SaaS (KVYO), neobanking (DAVE), specialty insurance (ASIC), mortgage tech (FIGR), marketing data (ZETA), education/healthcare payments (FLYW), and specialty pharma (ANIP). DLO is the first with primary exposure to emerging-market payment infrastructure.
Cover image: AI-generated editorial card.

Add more perspectives or context around this Post.

  • Sign in to comment.